Gallery
The following examples are not intended to be particularly pretty or spectacular images, but to demonstrate the capabilities of the toolkit. All the scene files used in this section are available as examples in the Gallery section of the ART source tree. Also, the scenes shown here are only an initial selection: more will be added in the near future.
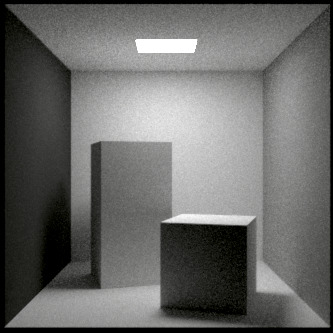
The Cornell Box: Basic GI
First, to warm up, here is the mother of all GI test scenes, the Cornell Box:
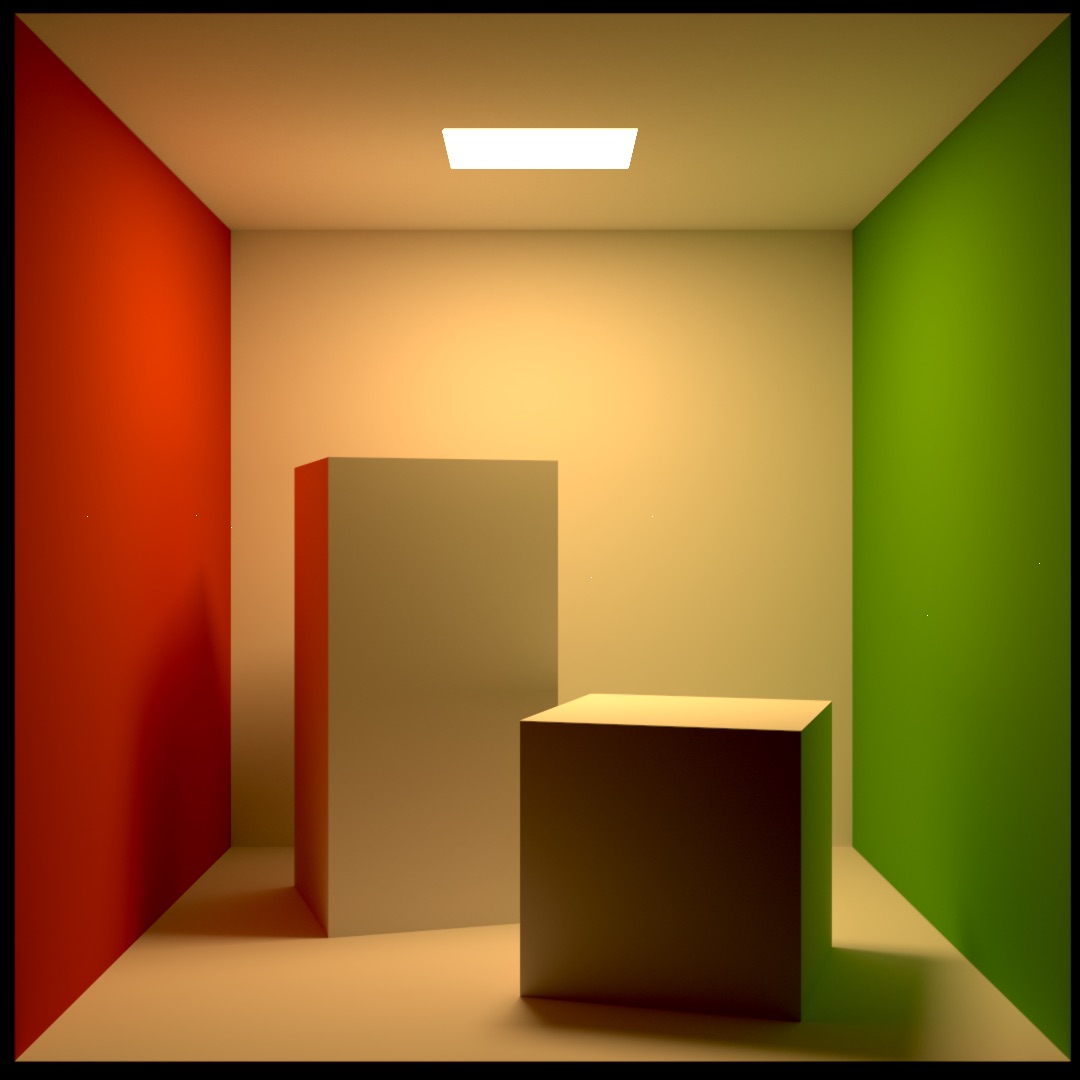
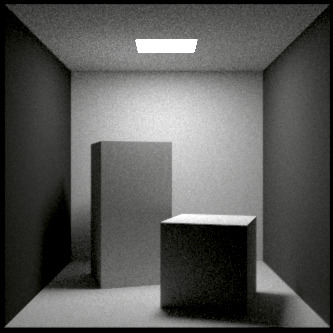
Note that this is a rendering of the Cornell box: as far as input data are concerned, this is an exact replica directly based on the measurements provided by Cornell. ART uses a proprietary scene description language with file extension .arm: in the downloads section, we provide a file format manual which walks through the creation of this particular scene step by step. A key feature of .arm files is that one can directly use the spectral reflectance data (and of course also the geometric information) provided on the Cornell site: and the renderer artist then generates a path traced spectral output image in .artraw format. This spectral image can be converted to displayable TIFF format via the tonemap command, which yields the above RGB picture. But one can also inspect single wavelength slices, like so:
# the first command extracts a monochrome EXR at 450 nm
tonemap CornellBox.artraw -wxr 450

# which is then tone mapped via the second command
tonemap CornellBox.450nm.exr -iac

# use tonemap -h to list all functions of this executable
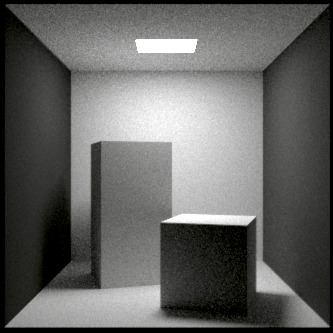
These are results for the above image at 410, 450, 500, 550, 600, 650 and 700[nm] (not tone mapped with equal exposure):
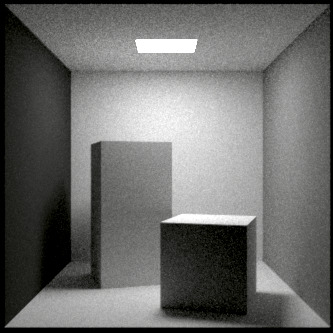
While this is not a spectacular achievement, it is still sort of neat: we can directly use spectral input data, and have the path tracer generate spectral images which we then can pick apart on a wavelength-per-wavelength basis, if we are so inclined.
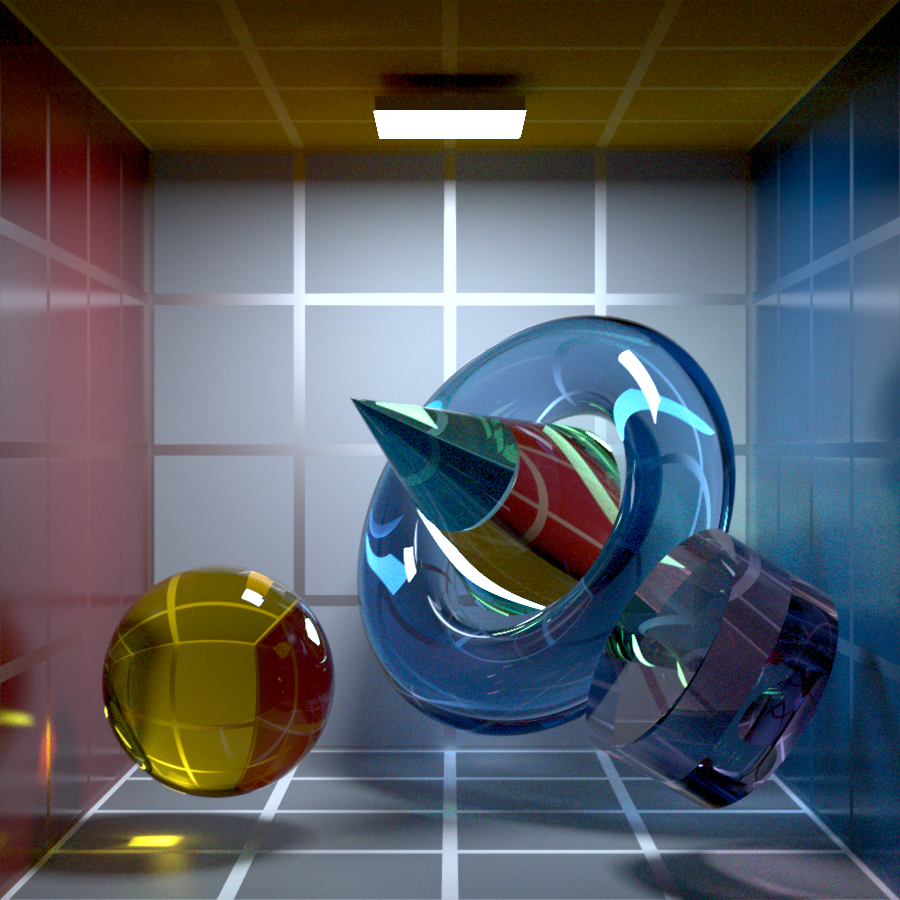
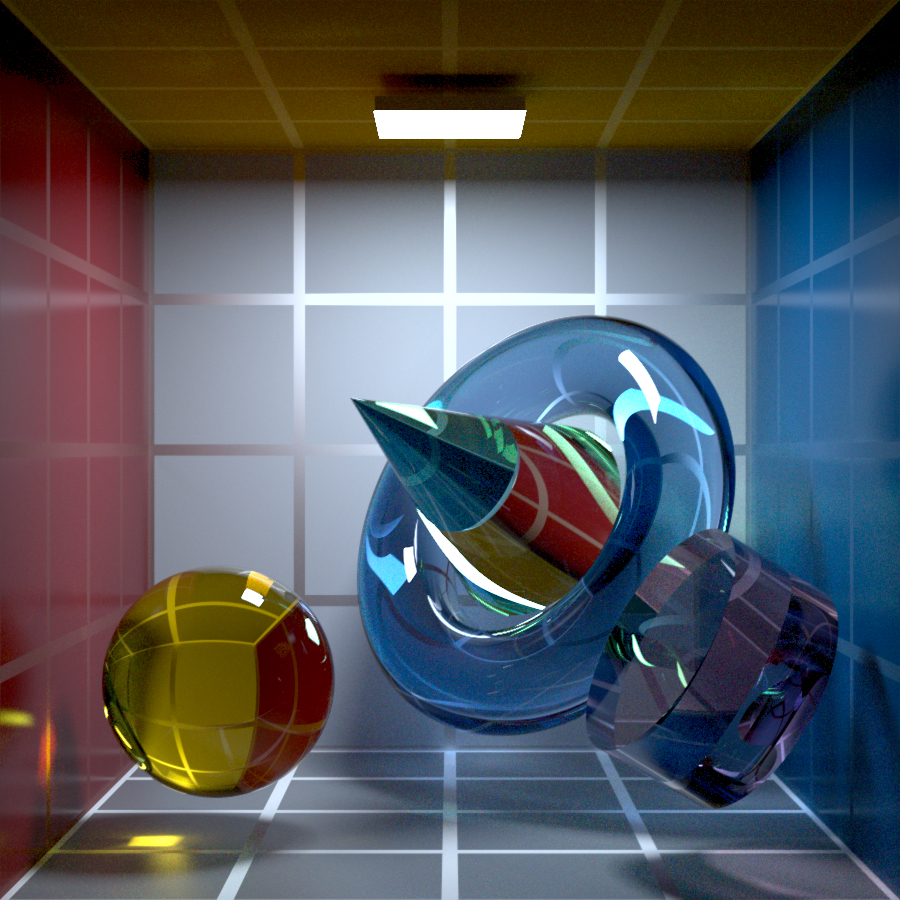
The ART Quadrics Box: Polarisation
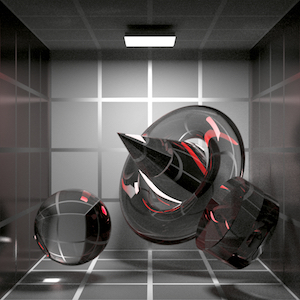
A slightly less trivial GI test box is the following example: it features a number of quadric shapes made from a transmissive dielectric material, plus a variety of procedural surface materials on the walls. The left and right walls feature layered materials, with a glossy transparent dielectric over a Lambertian base. The line patterns have a different roughness. The rear wall is Lambertian with a rough metallic Torrance Sparrow line pattern, while the top and bottom wall are pure Lambertian.
If this scene is rendered with the option -p, path tracing is done with the polarisation state of light taken into account. The resulting .artraw image then also retains the polarisation state for each spectral pixel, and polvis can be used to visualise this information. From left to right, the false-colour visualisations shown here for a wavelength of 550[nm] are (1) the degree of polarisation, (2) the prevalence of linear polarisation over circular, (3) the orientation of linear polarisation, and (4) the handedness of circular polarisation.
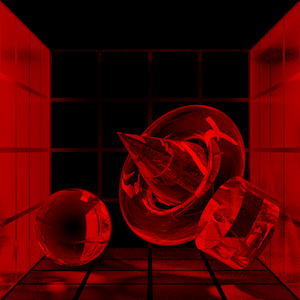
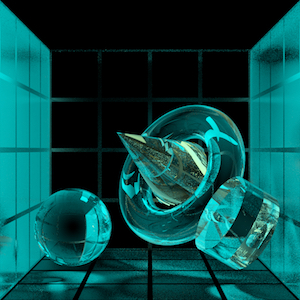
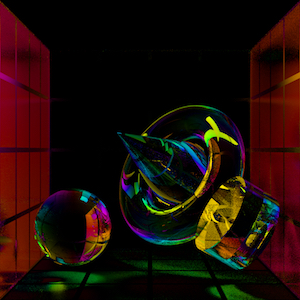
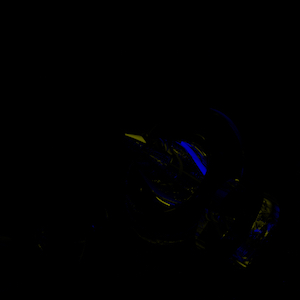
Note that circular polarisation is only evident where linearly polarised reflections off a dielectric surface undergo total internal reflection in the green cone. TIR causes a non-integer phase shift, an effect which is also exploited in the construction of Fresnel rhombs.
Via the -so option (scaled overlay), polvis can also superimpose this information on luminance information at the given wavelength: this sort of visualisation is better suited to assessing the relevance of polarisation data. If a colourisation is still visible in the scaled overlay plot, it would e.g. affect appearance if a polarisation filter were rotated in front of the image.
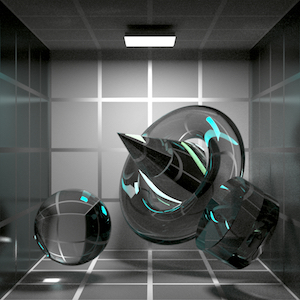

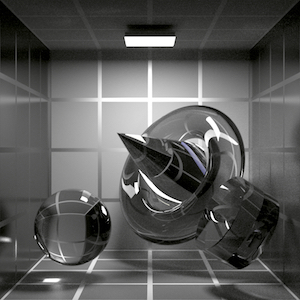
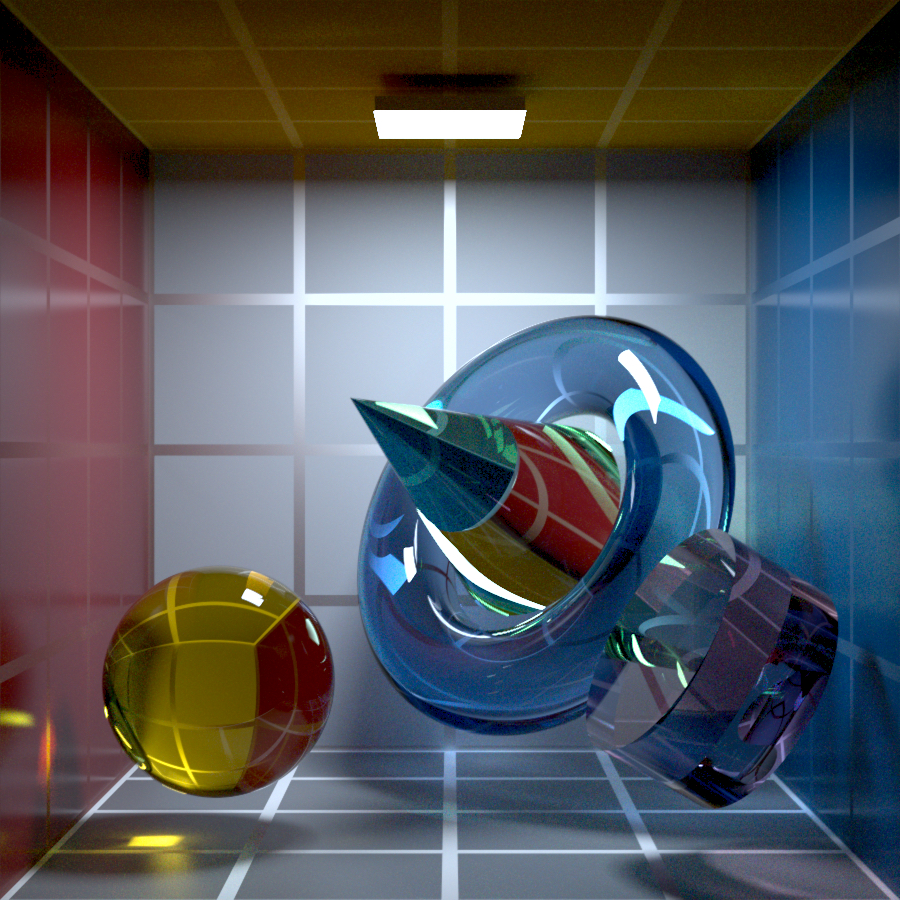
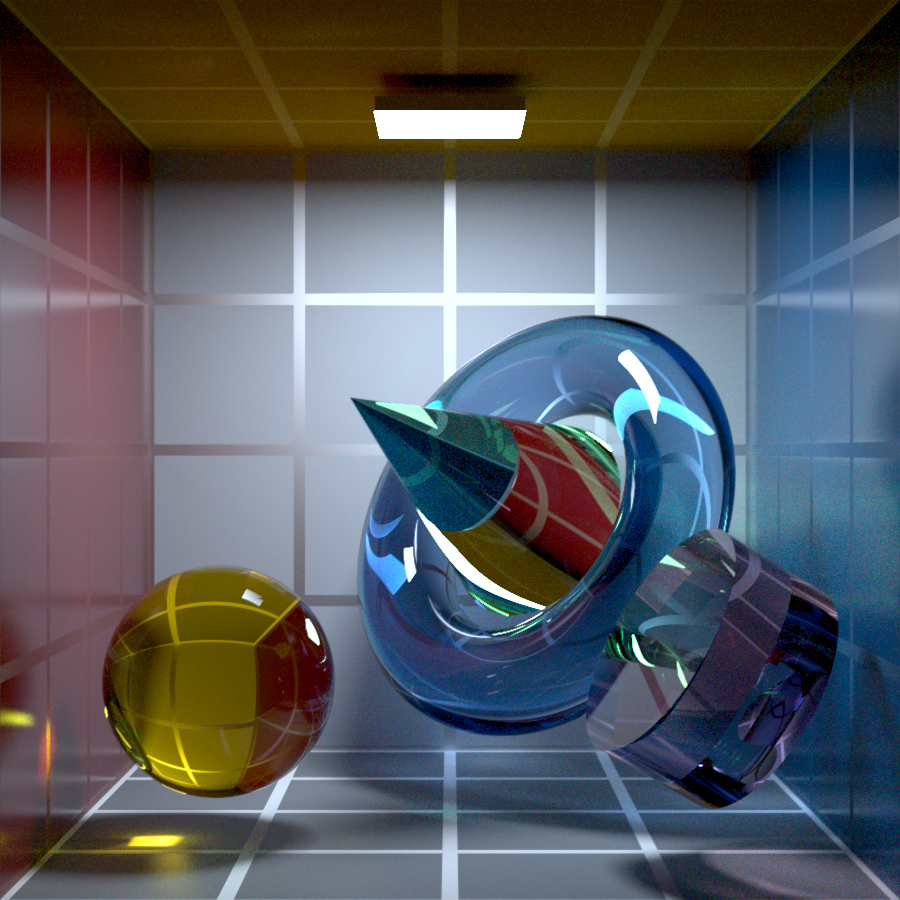
Which is of course something you can also do with tonemap: for polarised input images, it offers the option -lf <angle>, which simulates the effects of a linear polarisation filter. Here, we used (from left to right) the angles of 0, 30, 60 and 90 degrees - note how rotation of the filter affects the intensity of the glossy specular reflection seen in the layered dielectric on the walls:
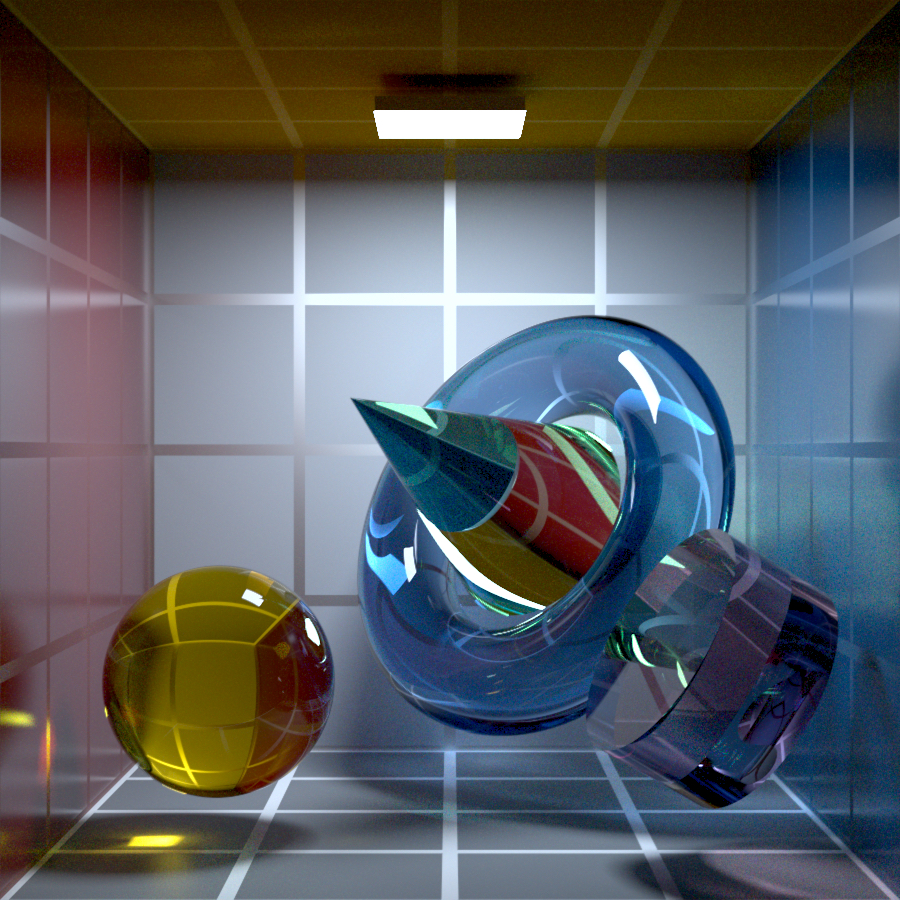
If the resulting images were tone mapped with exactly the same exposure as the main image, they would of course be darker than without the filter, as a linear polarisation filter always removes at least 50% of incident light. Here, they are roughly equally bright as the original, as the automatic exposure of the tone mapper compensated this.
Skylight Modelling & Fluorescence
The following scenes are from a 2012 SIGGRAPH paper which presented the Hošek skylight model, and from a 2013 SCCG paper about rendering of alien skies. Both showcase the effect of the ultraviolet component of the sky model on fluorescent surfaces.
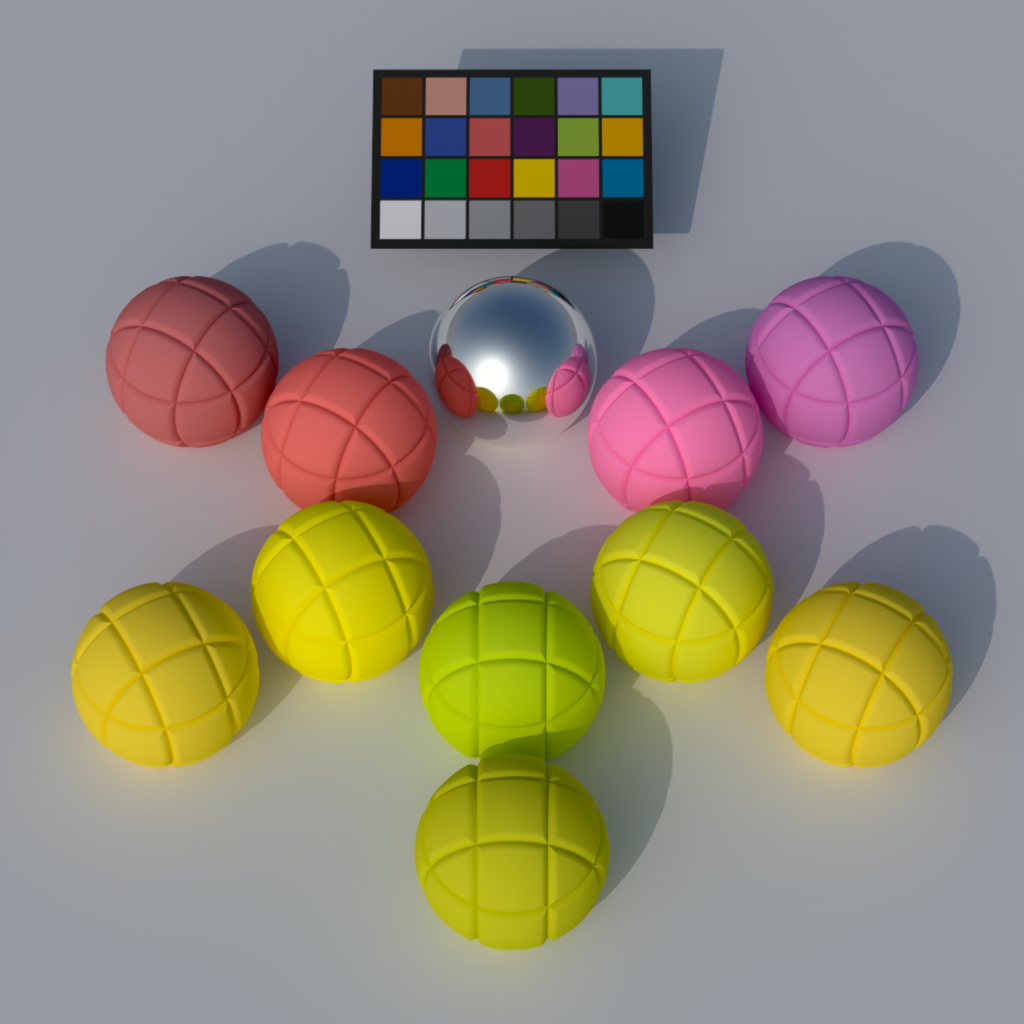
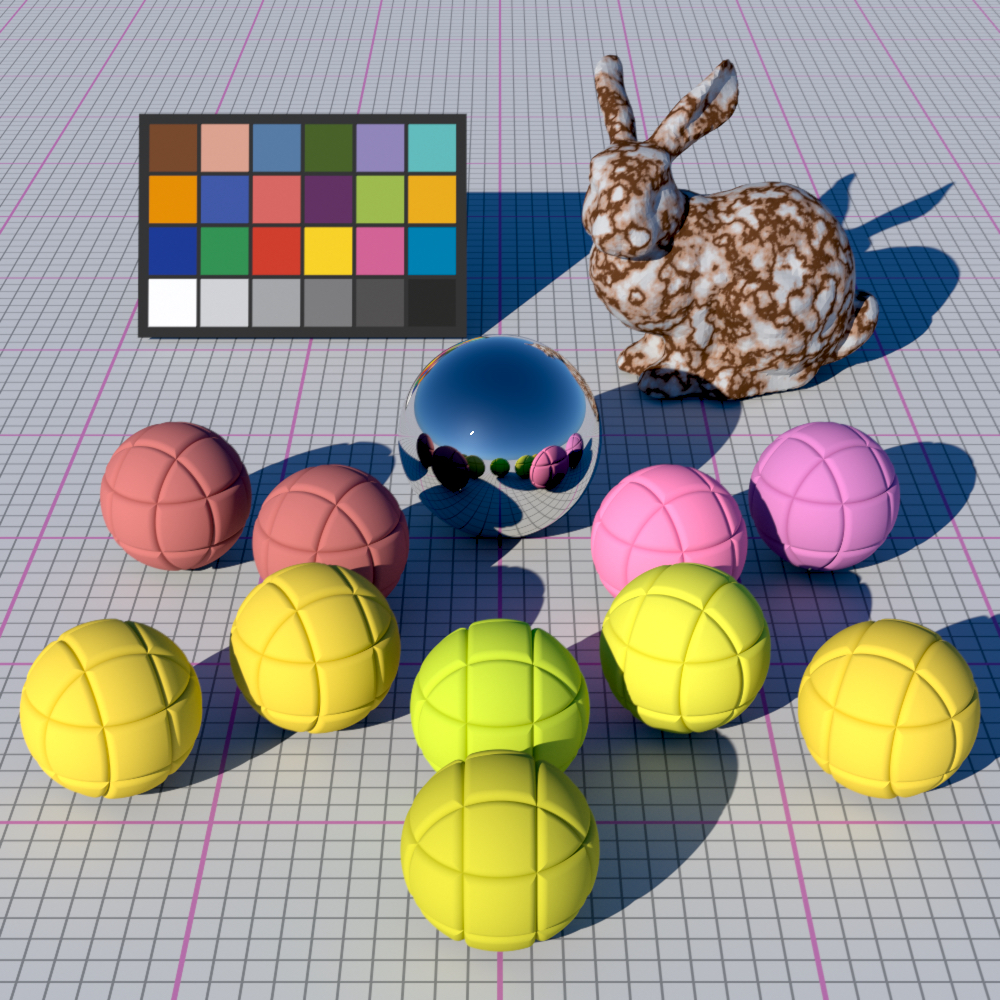
The inner ring of spherical objects exhibits fluorescence, while the - otherwise identical - outer objects do not. Due to the ultra-violet component of the Hošek sky model, these surfaces “light up”, and are more bright and colourful than they would otherwise be.
BRDF Models
Example images of the BRDF models which are available in ART. This section is missing specimens: what is here on release day is a selection of rough Torrance-Sparrow surfaces on metals and dielectrics.
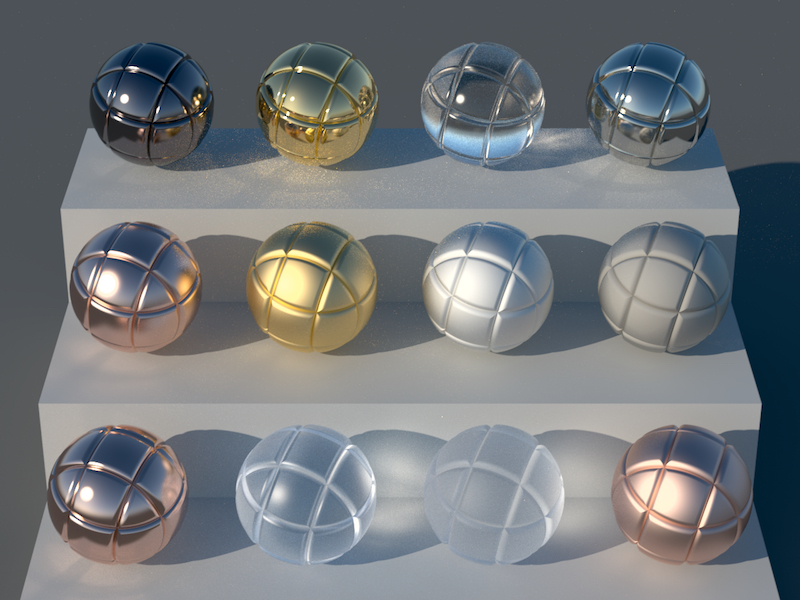
Note that even with a high sample count, the uni-directional path tracer is not able to completely resolve the solar caustic of the second sphere from left in the top row, which has an almost perfectly smooth surface.
Procedural Modelling
The recursive CSG snail shell is an example of procedural modelling in an .arm file. The source of this scene can be inspected in the procedural modelling section of the gallery scenes, and creates the snail shell via a for() loop that adds shell segments which are successively rotated and shrunk. As explained in the ART Handbook, .arm scene files are Objective-C source code, so procedural generation of shapes in the scene file code is extremely easy to do. The procedural noise texture blends a few metallic Torrance-Sparrow surfaces of varying roughness.
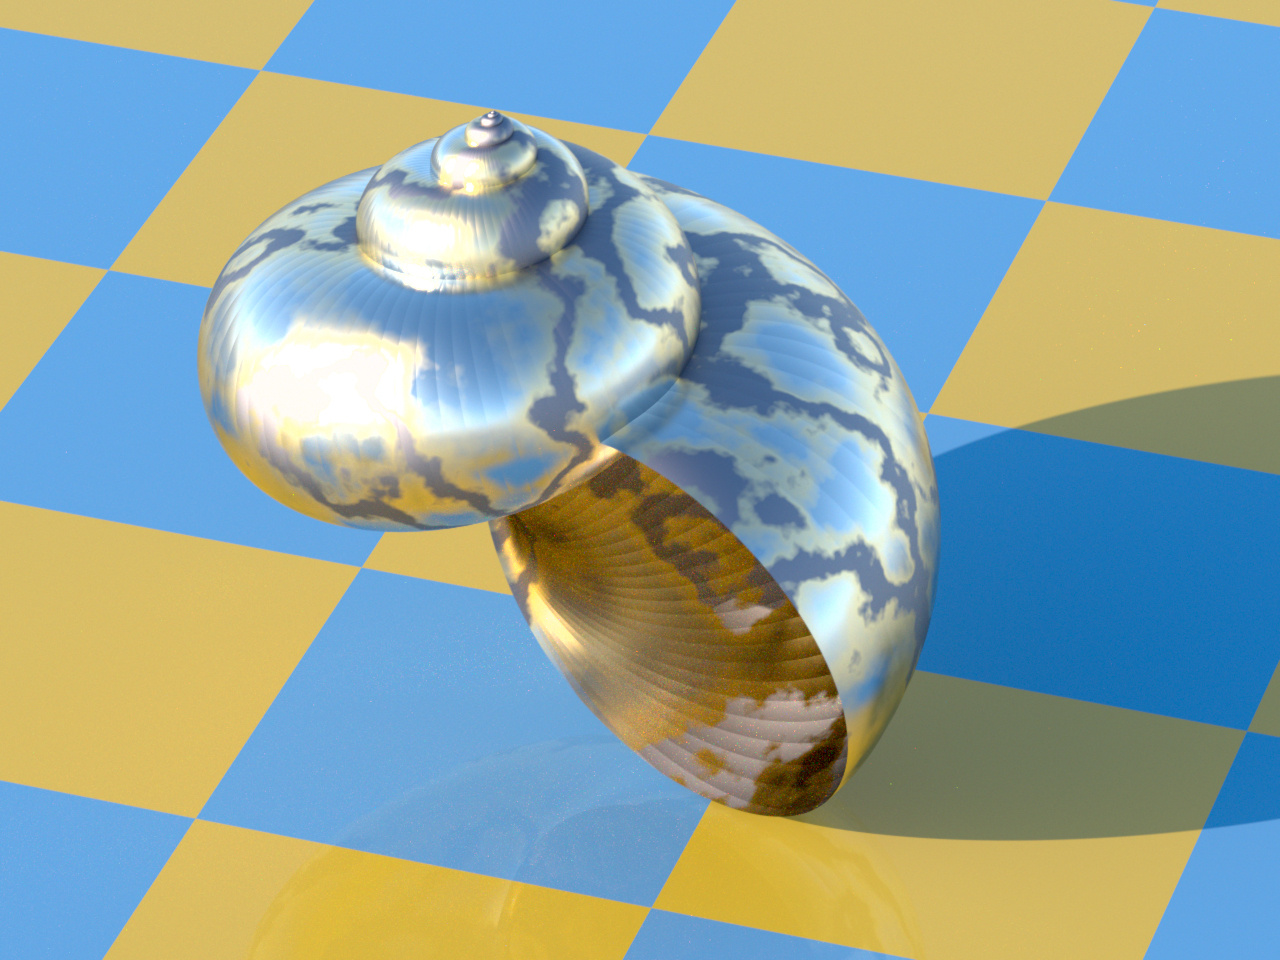
Normally, tonemap turns spectral .artraw images into tone mapped TIFF images. But if the option -exr is used, the final output image is actually an OpenEXR image:
tonemap SnailShellScene.artraw -exr
The EXR which results for this scene can be downloaded here: use an HDR image viewer to inspect the structure of the very bright highlight on the shell.