Task 113: Plotting 2D Functions with OpenGL
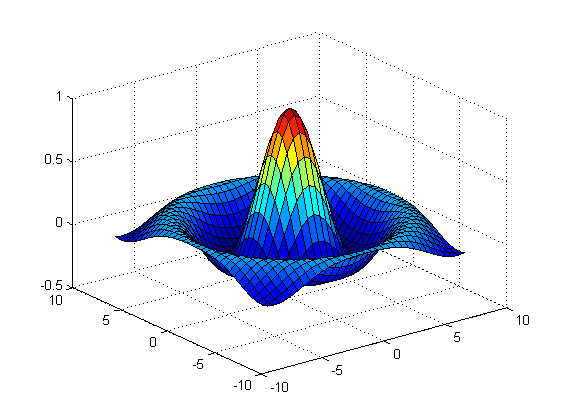
Your task is to implement a nice and practical tool to visualise real functions of two variables. You should display the graph of a function given as y = f (x, z), and allow the user to view it from all sides as well as allowing them to change the area over which the function is being visualised.

Expression evaluation: in order for a user to be able to enter a function of two variables, we use the NCalc, library, which is able to repeatedly evaluate a given expression, bind variables to numerical values, etc. In our application the two free variables are named x and z, and the function we display in 3D is y = y(x,z). Example code how to use the NCalc library to evaluate an expression can be found in the RegenerateGraph() function in Graph.cs.
Overview
The template application 113graph from the repository grcis serves as the basis of this project. This is an OpenGL-based application which renders the user-supplied function, and reads and sets parameters.
To implement your solution, you will have to complete the following functions in Graph.cs:
- RegenerateGraph ( string par, string expr ) - this is called whenever "Regenerate" is pressed, or when "Param" or "Expr" change. The first is a text-based configuration string (intended to control rendering appearance, the definition area of the function, etc.) and the second one is the user-defined function (with independent variables x,y or x,z)
- RenderScene() - this function is always called when the function is re-drawn. Here, you can add additional objects to the rendering, such as coordinate axes, planes, tangents, and such.
- Intersect() - this function is called when the mouse is clicked on the graph. Parameters are the ray starting point, and the direction vector. It should calculate the nearest intersection point with the function in parametric form.
- Mouse*() - handling of mouse events
- KeyHandle() - handling of keyboard events (the framework already uses the keys 'f', 'o' and 'r')
We recommend to retain the basic workflow of the demo application: the function RegenerateGraph() (only in case of changes having occurred) re-allocates or otherwise just fills out the needed VBO buffers, one with the attributes of the vertices, and the other with index information. The function RenderScene() does not re-compute the actual function values, but uses these buffered values instead.
InitParams()
This function is used to initialise the interface elemenst, and to set application parameters. It is called once, when the application starts up:
- param - initial contents of the parameter field (at minimum, this should contain a definition of the plotting domain)
- tooltip - a comma-separated list of parameters that are contained in Param:
- expr - initial arithmetic expression (see NCalc)
- name - your name
- trackballButton - which mouse butting should serve as Trackball?
Displaying the Function
The project uses the Trackball functionality, and you can choose which mouse button serves as the trackball trigger. The other buttons are available for your own function extension (such as triggering of a view ray).
Additional Features (Bonus Points)
Making the appearance of the visualised function more interesting (transparency, complex illumination, showing coordinate axes/planes), providing diagnostics at a point the user clicks on (tangent vectors, curvature, tangent plane), interactive changing of the definition area, reading the function definition from a text file (config.txt, auxiliary variables? ..), and anything else that will lead to a more elegant and comfortable application.
Deadline
Hand in until: 28. 02. 2022
Points
Basis: 8 points (for a simple but functional visualisation).
Bonus: up to 12 additional points for additional features (see above)
Project
Visual Studio projects: 113function
Source file
Modify and hand in the source file: Graph.cs
As a comment in the first line, please include your name!
Copyright (C) 2010-2022 J. Pelikán & V. Tázlar, last change: 2022-02-02 01:03:41 +0100 (Wed, 02 Feb 2022)