Assignment 118: Enhanced histogram
Your task is to implement a more interesting version of the raster image histogram that is part of the basic 117raster project.
Template
The 117raster project from the repository grcis (GIT) serves as a basis of the solution: the underlying framework is described here.
You place your new class(es) in a separate directory, and at the end submit the solution by zipping that directory and mailing it as an attachment. Please don't interfere with the 117raster project source files: if you encounter a bug in the base classes (to be more specific, a severe bug which makes it absolutely necessary to alter the project code), please contact us immediately, and we will fix it ourselves so that all lab participants can benefit from the bugfix.
Demo code
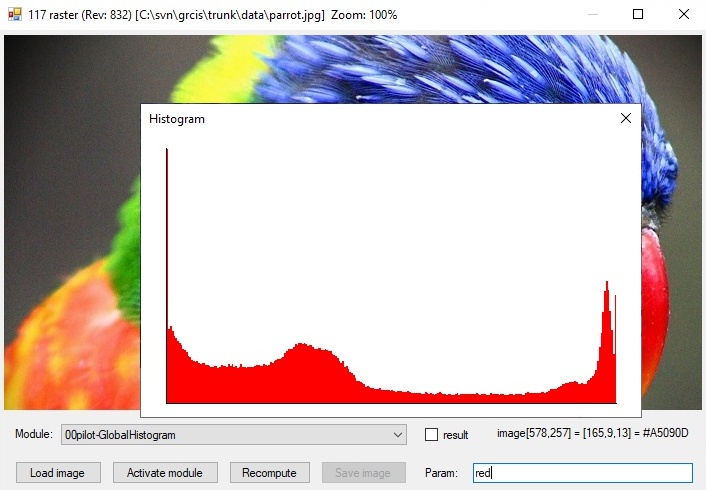
For your reference, a simple global histogram is implemented as a module (see) and located in the 117raster / ModuleHistogram directory. There you will find a few files that we will discuss in more detail:
Histogram.cs – Contains the ImageHistogram class which implements the actual histogram calculation, and the plotting of its graph. The histogram is calculated from the whole image and the calculation algorithm is naive (two nested for-loops, and pixel reading via Bitmap.GetPixel(x, y), which is very slow). Four modes are available: grayscale, or the individual color channels R, G, B. Rendering of the histogram graph is implemented in the DrawHistogram(Bitmap) function. The basic idea is that the graphics are drawn in a "backing store" that is accurately scaled to the size of the visualisation window, and which is later rendered by Windows (via a Paint event), where this bitmap is directly used. It is only necessary to redraw the graph(s) after resizing the visualisation window (Resize events). Redrawing graphs is much less computationally complicated than collecting histogram data, so the two phases are separated and allowed to perform separately and efficiently - for example, charts are re-drawn only when the window is resized, and the entire histogram will only be recalculated if input data or parameters have changed.
HistogramForm*.cs – a simple visualisation window that renders its contents via a backing store, prepared by someone else - typically the IRasterModule module. It only responds to Paint, Resize and FormClose events. In the latter case it can notify the connected computation module that the window has been closed. The calculation module is also notified of the window size change (the graphics are redrawn).ModuleHistogram.cs is a demo module: an implementation of the ModuleGlobalHistogram class. It implements all interface requirements of a raster module (IRasterModule) and implements only a minimal set of items in which it differs from the ancestor of DefaultRasterModule. It uses the ImageHistogram computation class and the HistogramForm visualisation window. The ModuleGlobalHistogram class serves as an example of how to implement a new raster module.
Enhancement ideas
Local histogram – the module will recalculate the histogram in the PixelUpdate(x, y) method, and it will calculate it only from some limited neighbourhood of the given pixel of the image [x, y]. The size (or shape) of the surroundings should be configured via the Param.
HSV histogram – color frequencies will be calculated in another color space (HSV) and visualised in a different form (in the HSV color circle). To convert from RGB to HSV, you can use the ColorToHSV() function as follows:
 Color col = image.GetPixel(x, y);
 double H, S, V;
 Arith.ColorToHSV(col, out H, out S, out V);
Better histogram visualisation – drawing multiple charts into one image, adding labels, dimensioning coordinate axes, etc. You may need to look into some of the more advanced GDI+ + : Graphics Class drawing features.
The generated palette should be written into the output array colors, that you need to allocate to have the correct size, e.g. using colors = new Color [ 6 ]; for six colors.
The text parameter Param
Parsing parameters from the text field: You may use functions from the supporting library Util. An example is given in the pilot implementation: Util.ParseKeyValueList( param ); first breaks the text into comma-separated sections, and then searches for definitions in the form <key>=<value>. See the pilot implementation example (the function bool Util.TryParse( p, "name", ref val ) returns true if the key was found, and the val parameter is overwritten at the same time.)
What to hand in
At minimum, you have to hand in your new class - the module (the descendant of DefaultRasterModule) which contains your new functionality, along with any other classes that you have implemented in a separate directory. Submit the solution by zipping the entire directory, and mailing it to your tutor as an attachment. Do not interfere with the 117raster project source files - your solution has to be a stand-alone module that plugs into an unmodified 117raster framework!
Deadline
The solution is due: 3. 11. 2019
Points
5 pts for a non-trivial solution,
up to 7 bonus pts for a creative solutions.
Project
Visual Studio project: 117raster
Source file
A zipped sub-directory which can be used in the 117raster project.
Copyright (C) 2019 J. Pelikán and A. Wilkie , last change: 2019-05-09 17:52:59 +0200 (Thu, 09 May 2019)